Traders and analysts widely use candlestick charts to represent price movements of assets like stocks, currencies, commodities, or indices, analyzing and interpreting price action over a certain period..
Candlestick pattern is very important analysis to understand the markets and to deal with the charts by doing various technical analysis.
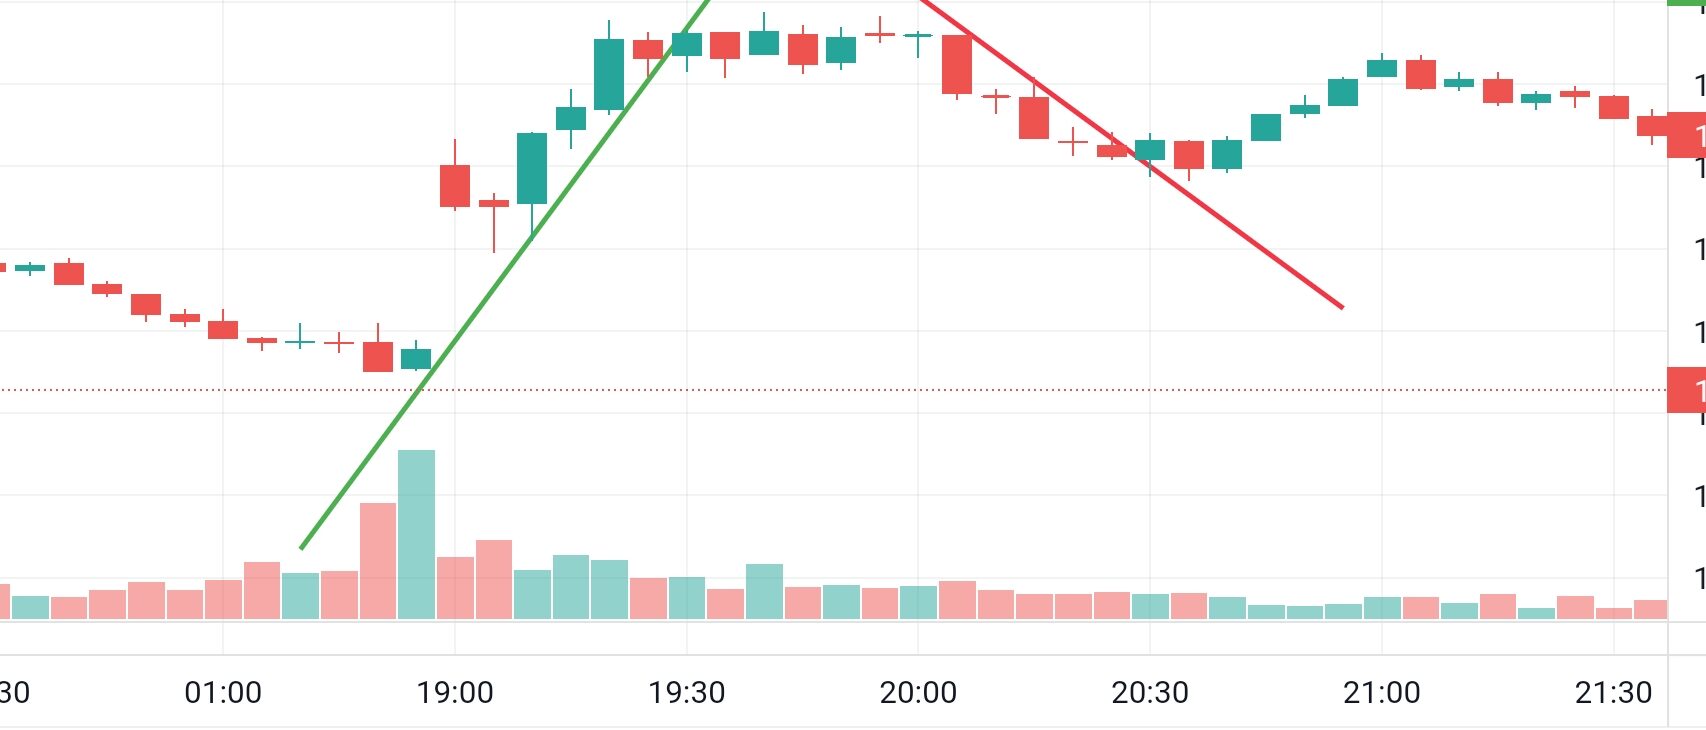
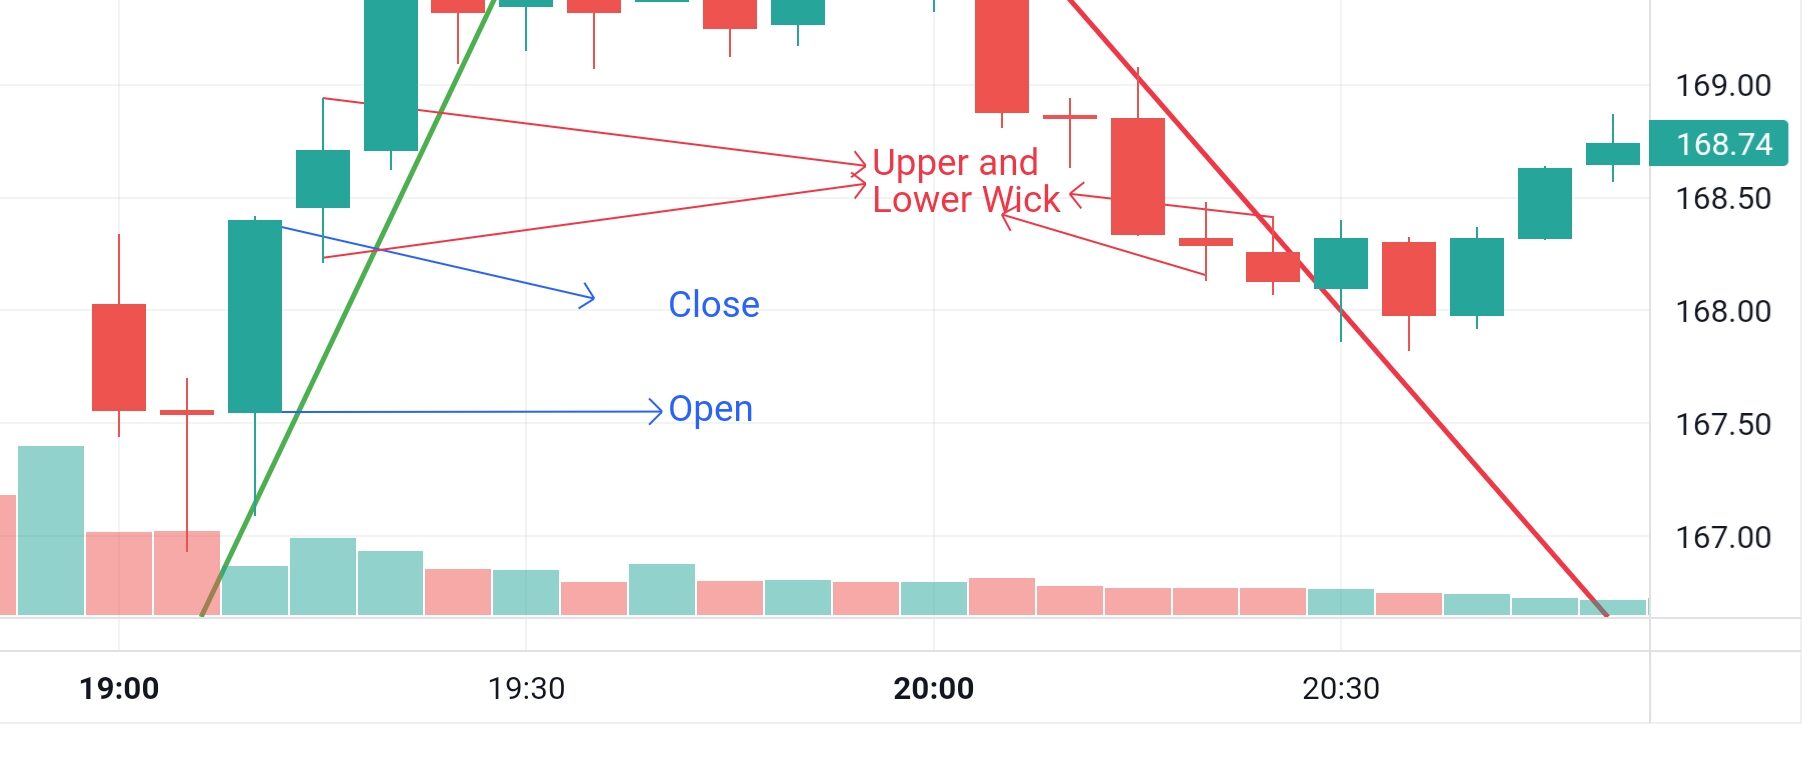
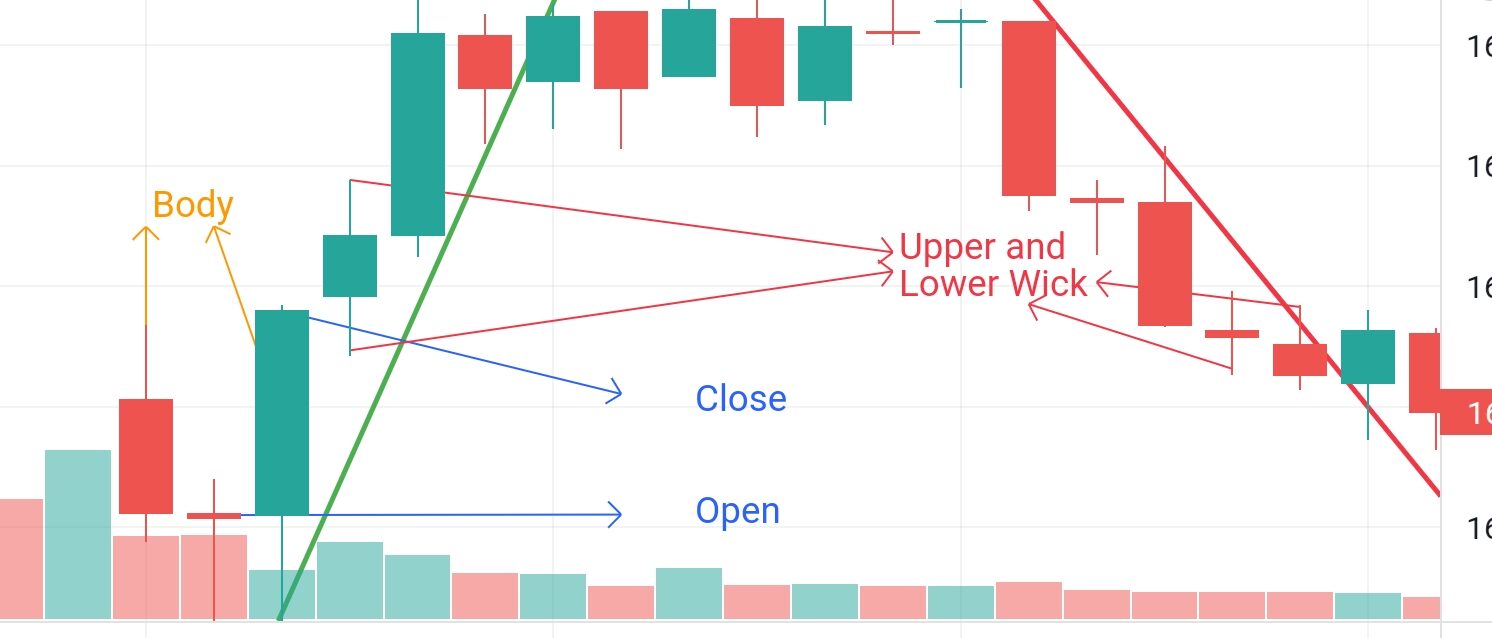
Different structures are illustrated in the chart below.
You may say the lines drawn to let you understand what are the market behaviours and how does the market performs. See it is very practical to understand that the markets are completely based upon the demand and the supply creators.
Moreover, two main players drive the market: suppliers, who create supply by selling scripts to push the market downwards, and demand creators, who continuously buy scripts to push the market upwards.
Also, it is not very easy to understand the market. Furthermore, you can see creating a supply or creating a demand is not at all possible to understand easily.
In addition, there must be methods to comprehend market dynamics. Sometimes, we can discern the creation of supply or demand through price action or by observing appropriate candlestick patterns. Therefore, understanding these patterns is essential.
Must Check: One Trading Guide to Understand and Use Easy Candlestick Patterns

Furthermore, you have understood the basic details of the candlestick pattern discussed with you. We need to focus on the proper candlestick, how we understand it during market hours and how it create an opportunity for everyone to earn money in any side. You can clearly see the candlestick that there are upper and lower wicks mentioned.


Know Your Personal Brand On LinkedIn: Elevate Your Professional Presence.


